Kirkpatrick E-Learning Training Evaluation: Move Beyond Completion Rates to Real Impact
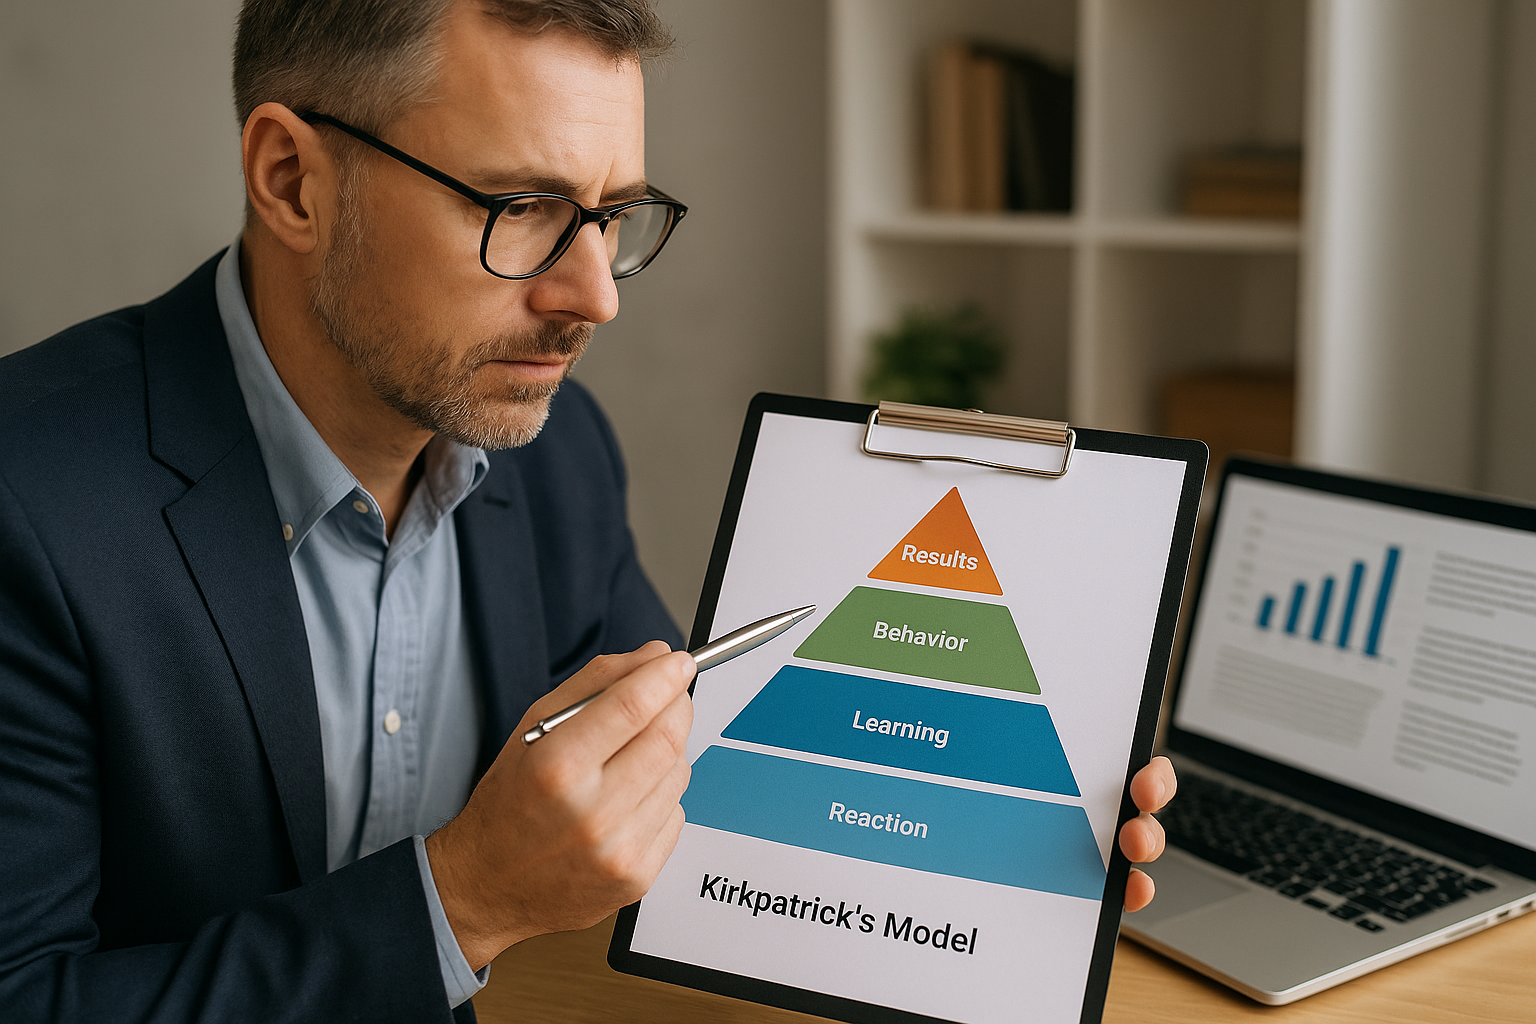
To demonstrate the effectiveness of your digital learning paths, choose a Kirkpatrick E-Learning Training Evaluation approach designed from the start. Using the 4-level model (Reaction, Learning, Behavior, Results) and the features of VTS Editor, you turn every interaction into usable data connected to your business KPIs. The result: you move from static reporting to continuous, clear, and actionable evaluation.
Why Structure Evaluation with the Kirkpatrick Model
What Training Really Measures
Beyond completion, the key is proving that your content triggers observable changes in the field and improves measurable business KPIs. The Kirkpatrick model helps frame this proof: satisfaction and engagement (L1), knowledge and skills (L2), workplace transfer (L3), and business results and ROI (L4). Meta-analyses highlight the importance of aligning evaluation levels with objectives and connecting learning to observable behaviors and operational outcomes (Alliger et al., 1997; Bell et al., 2017).
How VTS Editor Simplifies Implementation
VTS Editor allows you to design interactive, gamified experiences, place the right measurement points, and send data to your LMS via SCORM or VTS Perform. You can also call your APIs (Web Requests) to connect learning data to business KPIs. The goal: link each learning step to a meaningful indicator for decision-making and improvement.
Applying the 4 Levels of the Kirkpatrick Model to E-Learning
Level 1 — Reaction: Meaningful Satisfaction and Engagement
Goal: capture real-time perception. Go beyond “It was good” with micro-surveys after key sequences: perceived value, clarity, pace, intent to apply. Avoid long end-of-module surveys that result in vague answers. Add an NPS-style question and a free text field for verbatim if needed.
Level 2 — Learning: Knowledge, Skills, and Confidence
Goal: measure what the learner knows and can do. Vary formats (MCQ, drag and drop, matching, open-ended, sliders, numeric entries) and contextualize questions in realistic scenarios. Also analyze distractors, response time, and confidence. Research supports using simulations to strengthen learning and transfer (Sitzmann, 2011).
Level 3 — Behavior: On-the-Job Transfer
Goal: observe behavior changes at work. Use two sources: traces from simulations (paths, choices, hesitations) and field data (self-reporting, managerial evaluations, 30/60/90-day checklists). Plan post-training rituals during the design phase to avoid staying at the intention stage.
Level 4 — Results: Business Impact and ROI
Goal: connect training to business KPIs (quality, sales, safety, customer satisfaction). Be cautious: plan before/after comparisons, build comparable cohorts, and make attribution hypotheses clear. Set certification thresholds based on job requirements, not arbitrary limits. Critical reviews suggest contextualizing results and supplementing Kirkpatrick with transfer and working condition indicators (Holton, 1996; Bates, 2004).
Common Mistakes to Avoid
- Staying stuck at Level 1 without connecting to Levels 3 and 4
- Aligning KPIs too late in the project
- Failing to prepare for data collection
- Separating content and data, making analysis difficult
- Providing numbers without actionable recommendations
Implementing Kirkpatrick E-Learning Evaluation in VTS Editor
Measuring Reaction (L1) in VTS Editor
Place micro-feedback points throughout the journey. The Message block enables a short question with a “Continue” button. The “Phrase Choice” block creates a 1–5 scale; store the answer in a variable. A “Text Field” collects verbatim comments.
To send data to an external form (NPS, CRM, Google Form), use “Open Web Page” and pass the score in the URL. The “Web Request” block sends your data in GET/POST or JSON with authentication; store the response to provide confirmation. The “Progression” block synced with SCORM and VTS Perform tracks completion and time spent.
Measuring Learning (L2) with Rich Interactions
Leverage Quiz blocks (single/multiple choice, ordering, media), True/False, Matching, Drag & Drop, Text/Numeric Fields, Numeric Pad, Slider. Assign points, show correct answers at the end, and adapt next steps based on score. The “Score” block increments declared skills at the project level (e.g., “Diagnosis,” “Argumentation”), and “Check Score” unlocks, remediates, or redirects in real time.
Refine feedback: “Speak,” “Emotion,” and “Character Animation” humanize responses. After a mistake, direct gaze and a targeted resource via “Open Resource” create an effective debrief. “Slideshow” or “Foreground Video” serve as clear summaries. “Reset” restarts activities in training mode by clearing history.
Measuring Behavior (L3) Through Simulation
VTS scenarios replicate real work environments: branched dialogues (Phrase Choice), exploration (Clickable Zones, Set Interaction), media integrated into set (e.g., screen procedure). Use “Flags” and “Check Flags” to store key decisions (e.g., rephrasing, procedure compliance) and control what follows. Variables and Conditions enable adaptive pathways.
Encourage replayability: “Random” (draw a case), “Sequence” (chain scenarios), “Switch” (route based on a variable). Highlight key behaviors with a “Badge” synced with Perform. In 360°, “Freeze 360” and “Force 360” guide focus; “Countdown” simulates urgency and generates meaningful traces (stress handling). On desktop, “Recap” records key decisions for coaching.
Measuring Results (L4) and Connecting to Business KPIs
The “Web Request” block bridges your systems: send scores, skills, time, choices, and IDs (employee ID, BU, country) to a warehouse, CRM, or BI tool. You can also retrieve business targets (e.g., sales goals) and inject them into the scenario. The “Progression” block sets completion, success status, and overall score, sending them instantly to LMS/Perform. If certification depends on a threshold, “Check Score” issues a badge, congratulatory message, or remediation. You can even open an external dashboard (e.g., Power BI) with “Open Web Page.”
Accessibility, Engagement, and Immersion: Cross-Cutting Levers of Effectiveness
Making the Experience Accessible
Subtitles, text-to-speech (800+ voices), zoomable media, video control, multilingual support. “Language Condition” routes to FR/EN/DE versions effortlessly for learners.
Humanizing and Gamifying Learning
3D Characters, “Emotion,” “Character Animation,” and “Gaze” convey non-verbal cues for customer service, management, or safety. “Score” and “Badge” provide direction; “Teleport” and “Menu” simplify navigation.
Simplifying Usability
“Show Interface” helps with onboarding. “Wait” sets the pace, “Countdown” adds challenge, “Random” brings variety.
6-Step Kirkpatrick Evaluation Roadmap with VTS Editor
Align Objectives and Business KPIs
Start from field frustrations and identify 3 to 5 high-impact behaviors (safety, compliance, sales, customer relations). Break down your L1–L4 indicators and set success/certification thresholds with field teams. What’s undefined in the brief becomes hard to measure later.
Design the Evaluation Instruments
Map your measurement points on the graph: timely L1 micro-surveys, varied L2 tests, traceable L3 decisions. Enable skill tracking, use “Score” and “Check Score” to unlock, remediate or personalize. Plan “Badges” as powerful motivational and managerial markers.
Set Up Data Collection and Routing
SCORM and VTS Perform track completion, time, total score, and statuses. Go further with “Web Request” sending a JSON (IDs, skill data, timestamp) to your APIs; store the response to confirm to the learner. “Open Web Page” can redirect to a survey or dashboard. On desktop, “Recap” logs learning checkpoints for coaching.
Drive Engagement and Pacing
Adjust pace (“Wait” for pauses, “Countdown” for urgency). Clarify onboarding (“Show Interface”). Encourage replayability (“Random,” “Switch,” “Sequence”) and use “Reset” to give another try in training mode. In 360°, apply “Freeze/Force 360” to guide learner focus.
Analyze and Attribute Impact
Cross training data (Perform/LMS + Web Request) with business KPIs. Analyze by cohorts (country, BU, tenure) and run before/after or test/control comparisons where feasible. Ensure thresholds and badges align with operational requirements. Document attribution assumptions (observation period, parallel initiatives) and turn findings into action.
Continuously Improve
Iterate: fine-tune feedback (“Speak,” “Message,” “Emotion”), adjust difficulty (“Switch”), timing (“Wait/Countdown”). Refine logic (“Flags,” “Check Flags,” Variables). Industrialize what works (“Function Call,” variable media, “Reset”). Automate flows (“Web Request,” “Progression” with instant sending). Prioritize improvements that boost L3/L4—they’re what matter to the business.
Real-World Cases: Connecting Evaluation to Results
Example of Tangible Impact
The gamified simulation deployed at Manpower illustrated how embedded evaluation and gamification boost engagement and skill-building: engagement rose from 7% to 67%, 34,000 enrollments and over 41,000 catalog visits during the observed period. Discover the full case: Manpower Academy – Customer Case.
Why Proving Results Matters
Numerous studies link high-quality evaluation design to training effectiveness (transfer, results). They recommend combining assessment of knowledge, behavior observation, and business impact (Arthur et al., 2003; Bell et al., 2017).
From Measurement to Performance with VTS and the Kirkpatrick Model
Adopting a Kirkpatrick E-Learning Training Evaluation with VTS Editor means moving from “consumed” to “high-performing” e-learning. Every interaction becomes a data point, every skill a usable indicator, every simulation a behavior predictor, every result a piece of your business performance puzzle. To go further, explore VTS Editor and the VTS Perform platform to deploy, measure, and improve.
Ready to launch a 4-to-6-week POC? Choose a key module and business KPI, define your L1–L4 indicators and thresholds, design and measure in VTS Editor, deploy to a sample group, analyze, attribute, iterate. Book a personalized demo: Request a demo of VTS Editor. You’ll quickly get proof—backed by data—of your real-world impact.